Show Me The Money
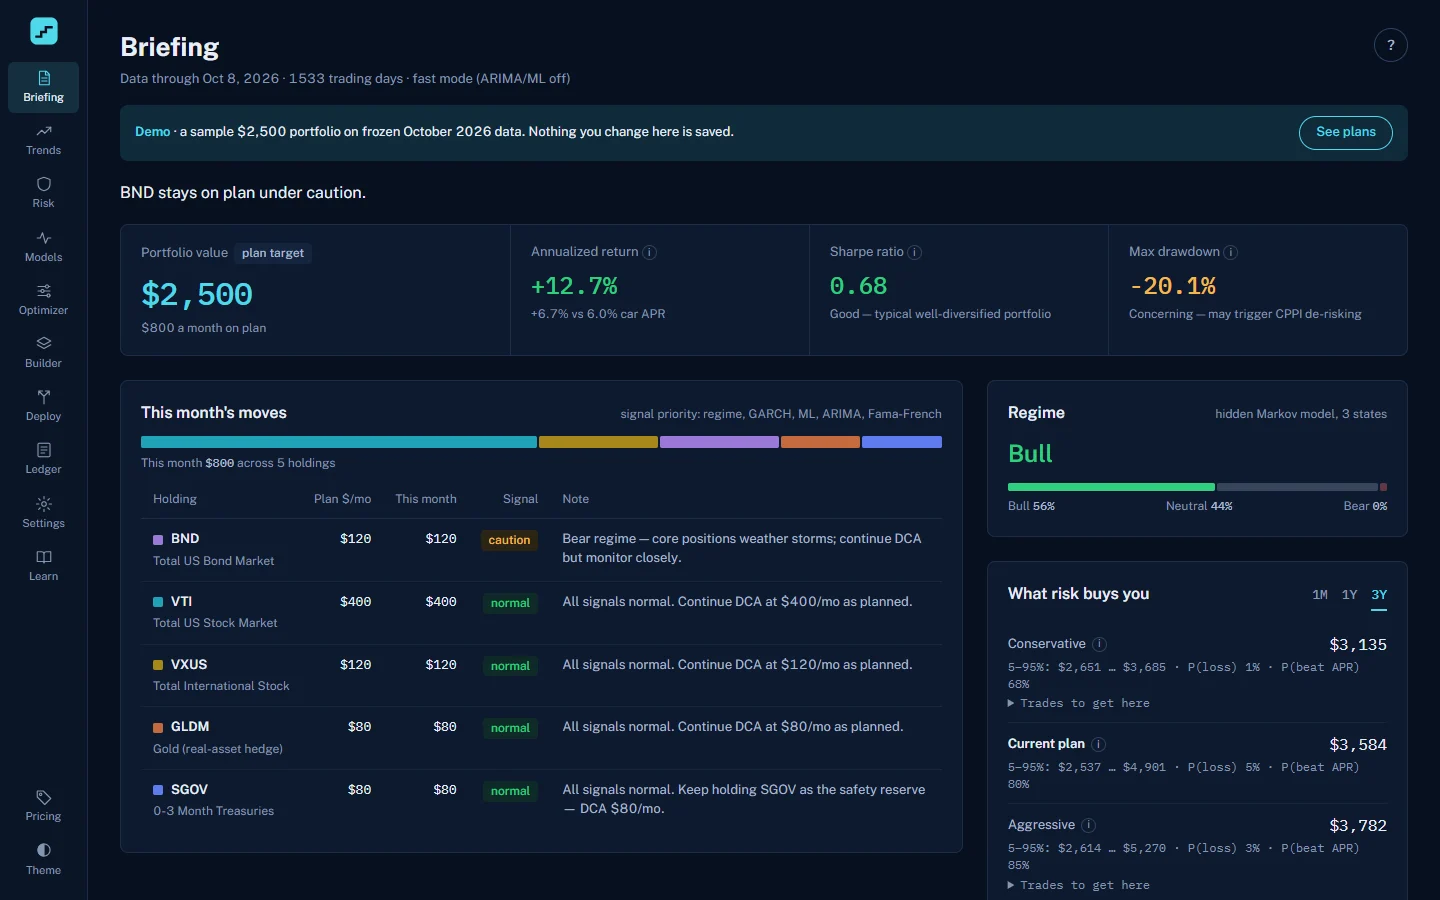
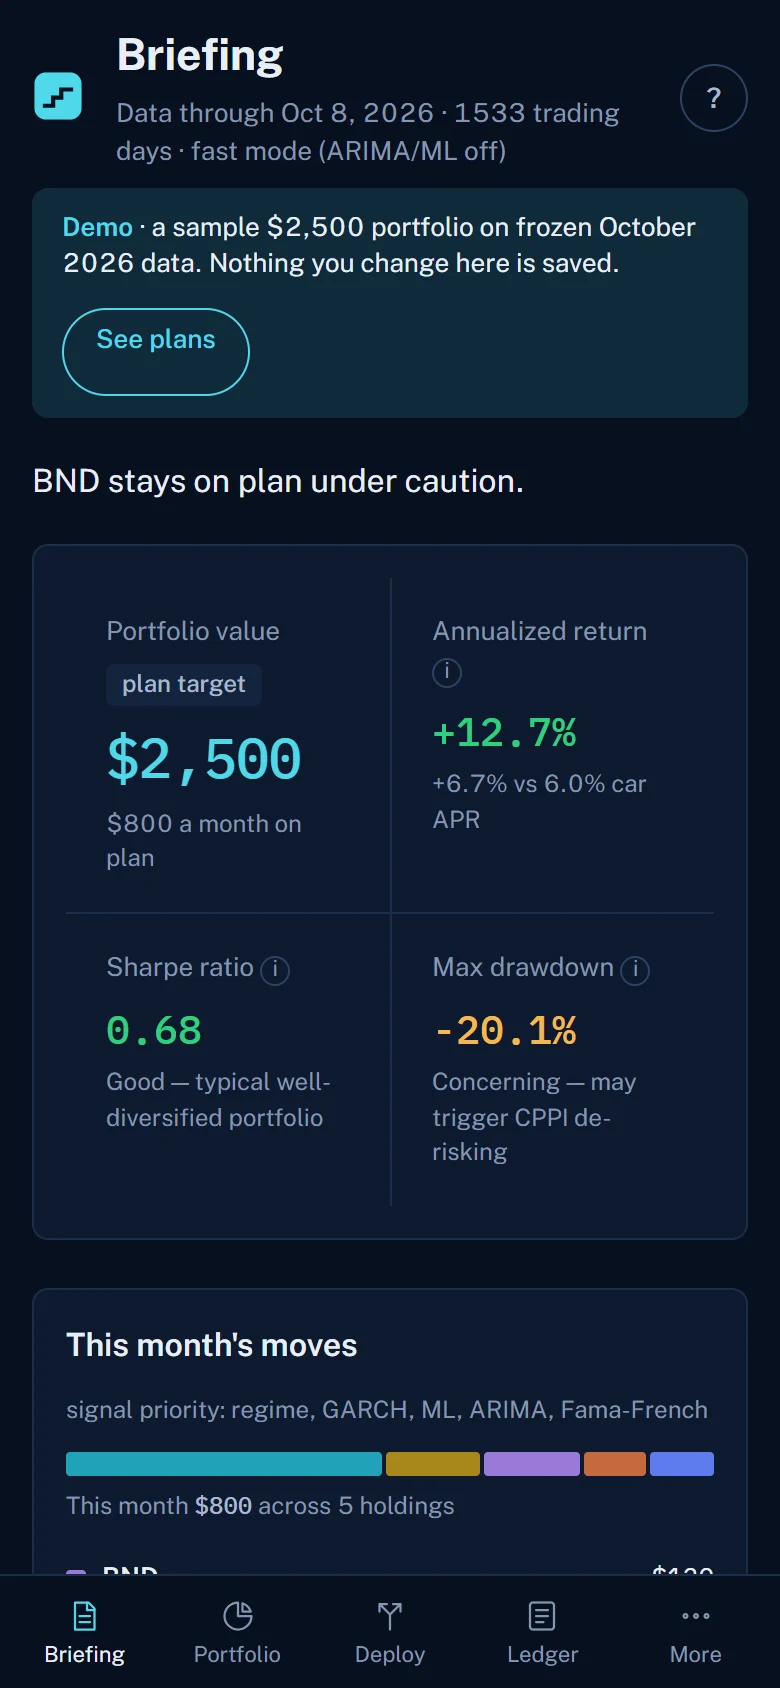
A quantitative portfolio cockpit: regime detection, GARCH risk, machine-learning signals, an optimizer, a planner for deploying a lump sum, and a monthly briefing that says in one sentence what to do this month.
Demo needs no account. Trial: 30 days free, then $9.99/mo. Cancel anytime in your account.
The idea
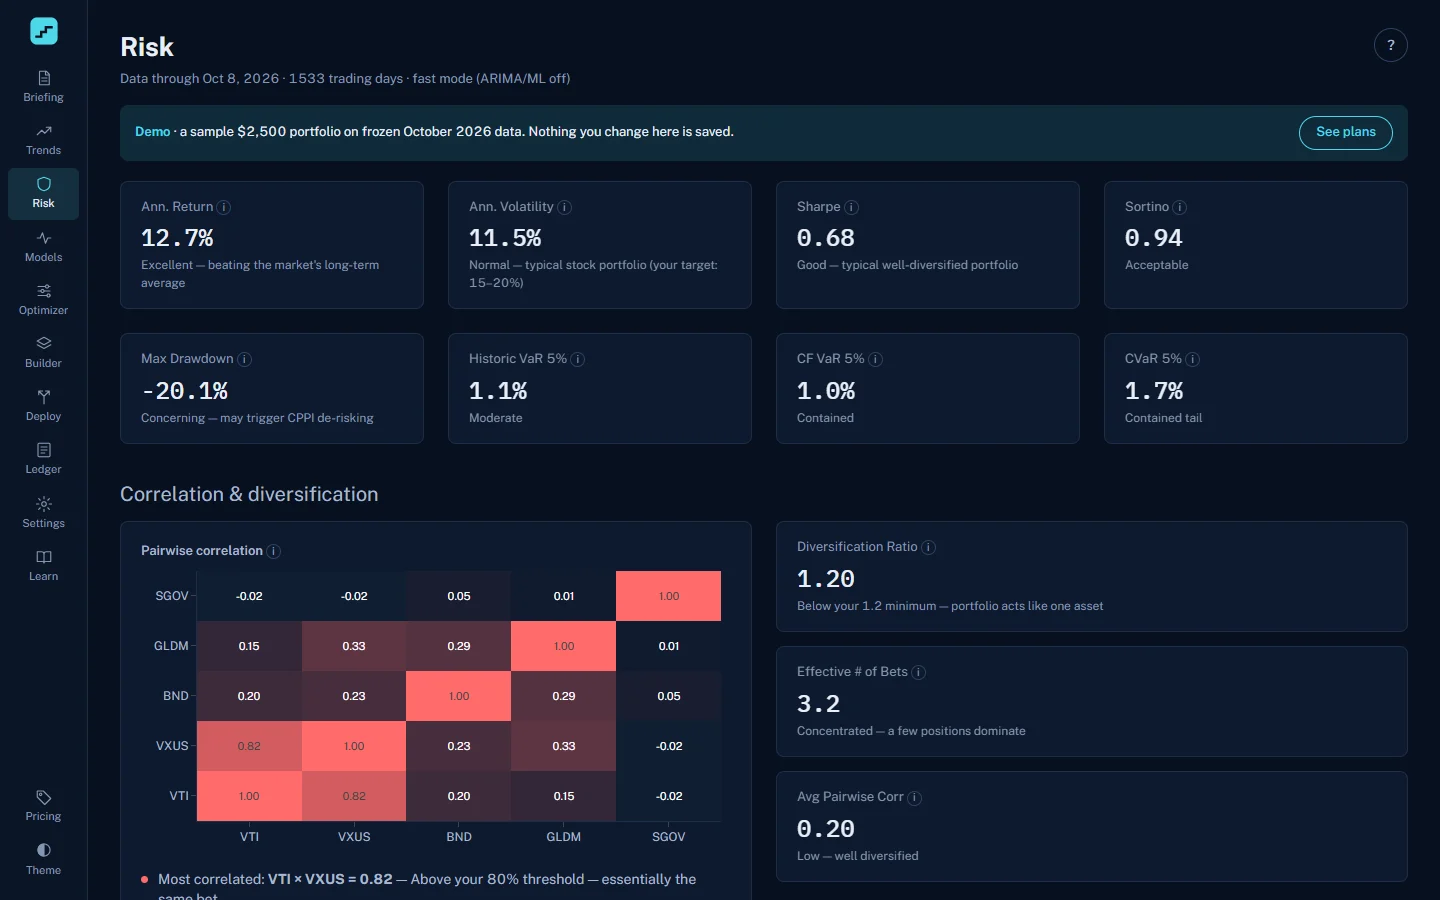
Dollar-cost averaging is simple until the market turns. Show Me The Money reads the regime (bull, neutral or bear) from a hidden Markov model, checks each holding's risk with GARCH and its signals with machine-learning models, then turns all of it into this month's moves: which holdings stay on plan, which pause, and where the paused money goes.
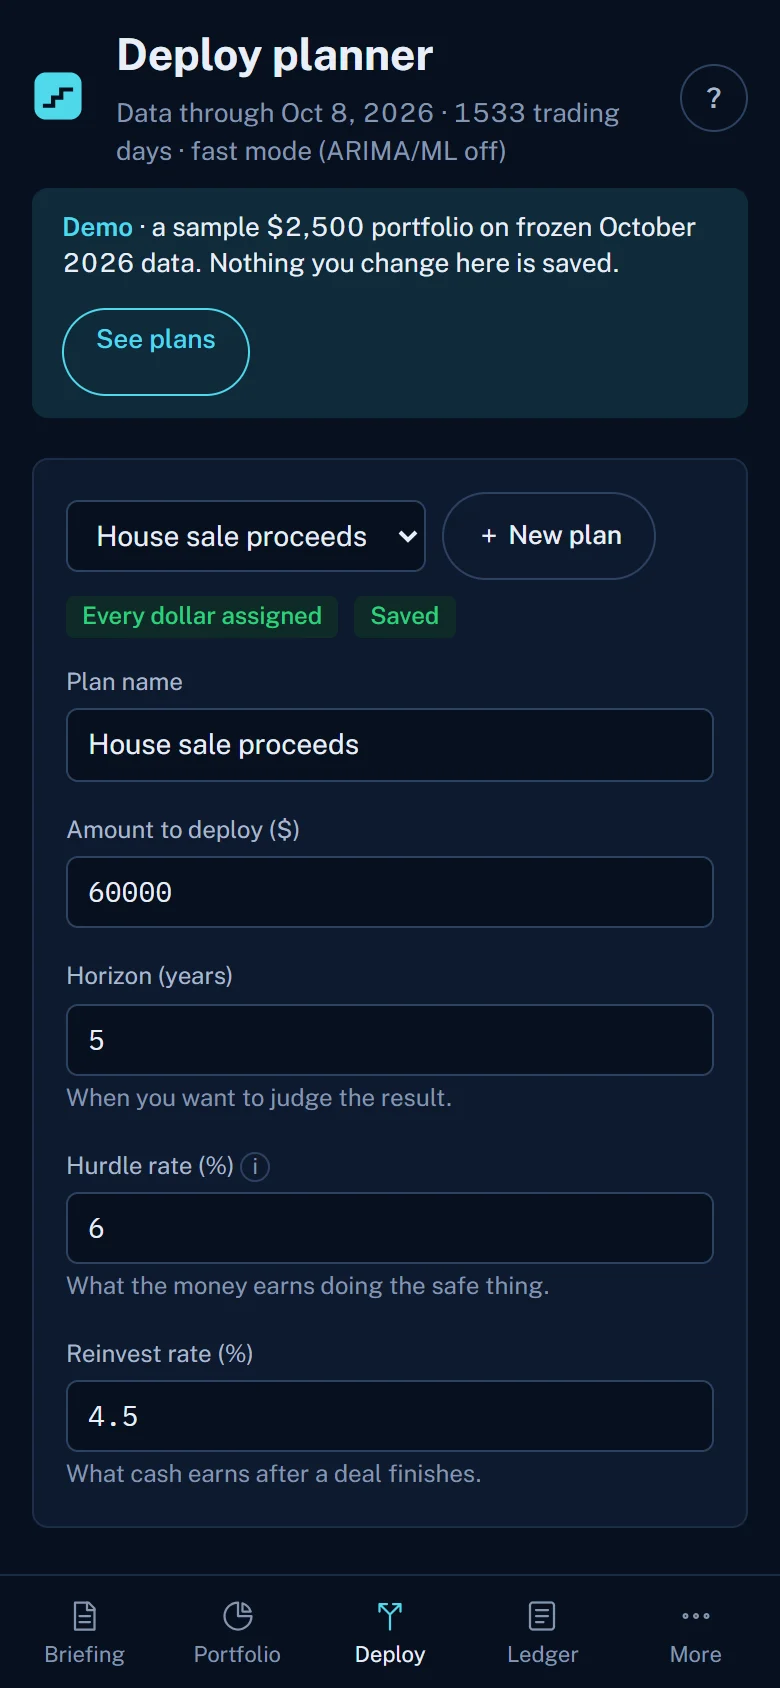
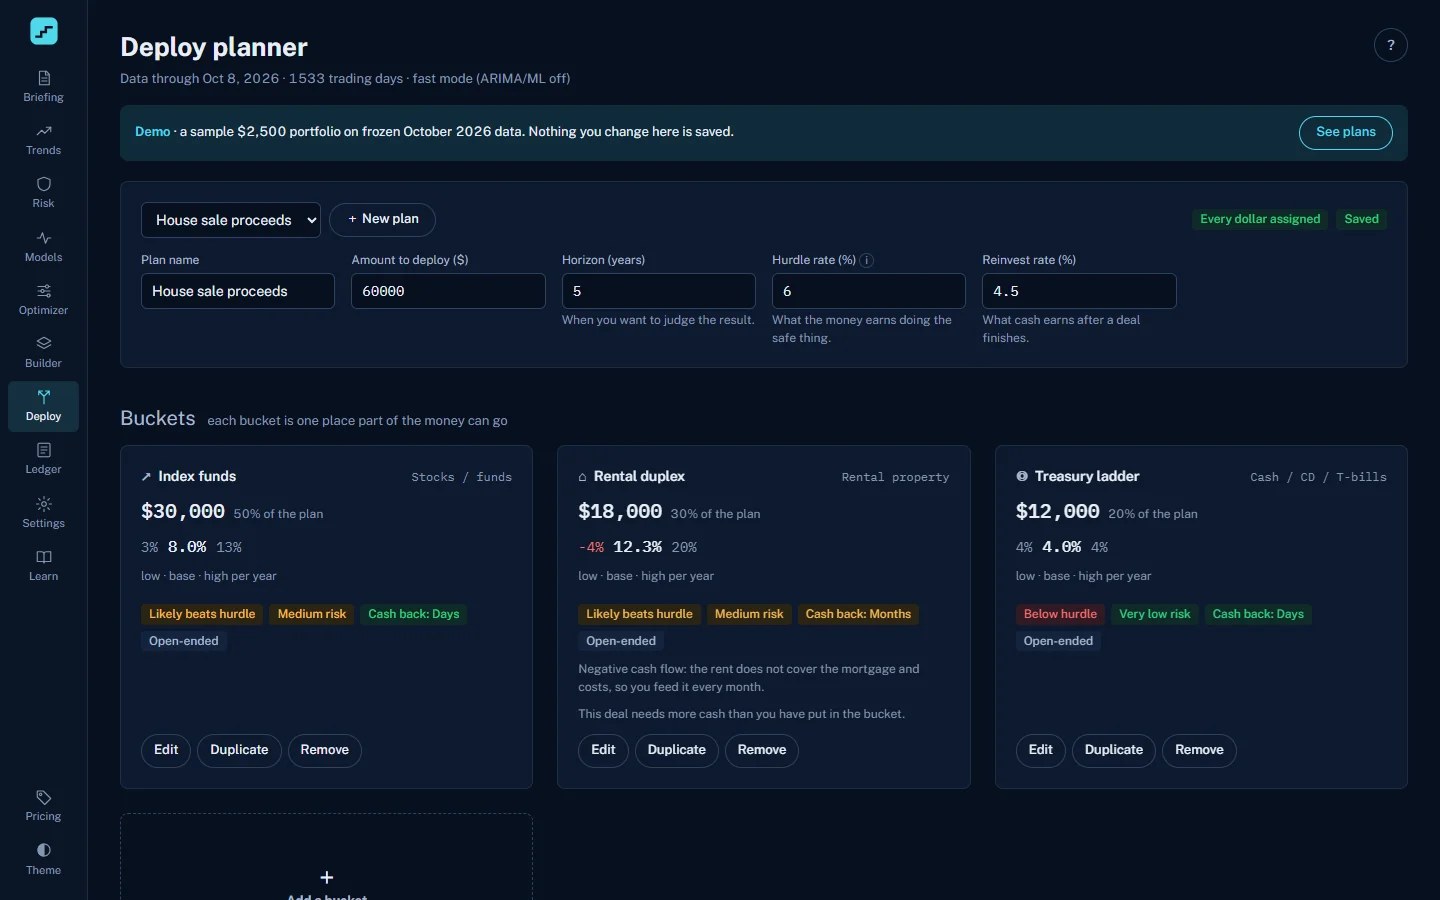
The Deploy planner handles the other question: you have a lump sum, and it could go to index funds, a rental, a flip or a treasury ladder. Each bucket gets a low, base and high case against your hurdle rate.
Screens
Plans
Free: Learn; Risk on 3 tickers.
Pro: $9.99 a month or $89 a year (save 26%). Unlimited tickers; Optimizer; Deploy planner; Monthly briefing email.
Every new Pro subscription starts with a 30-day free trial. Compare every plan, and the All-Access bundle, on the pricing page.